Most DTC brands spend $1,500 to $15,000 a month on Instagram ads. A $1,500 to $3,000 test budget proves one audience and one creative angle. $6,000 to $15,000 scales what won. Above that, Instagram is a line item you forecast. Your right number is target cost per order multiplied by the orders you need, and this post shows that math.
Andrew Cowan has bought Facebook and Instagram ads for close to 15 years, first as a brand-side CMO scaling 8- and 9-figure DTC stores and now at Parah Group, where paid social and the landing pages it sends traffic to run as one program. The tiers below come from that work. Every benchmark is a third-party range and every one is linked.
How much do Instagram ads cost? Meta’s minimums as of October 2026
Meta does not publish a fixed rate card for Instagram. Every impression is sold in an auction against other advertisers who want the same person at the same moment, and you pay for impressions (CPM), link clicks (CPC) or, in practice, whatever those add up to per purchase (CPA). What Meta does publish is a floor. According to Meta’s help center guidance as summarised by Cropink (April 2026), the minimum daily budget is $1 a day for ad sets billed on impressions, $5 a day for ad sets optimised for clicks, likes or video views, and $40 a day for low-frequency events such as app installs. Meta also recommends that a daily budget sit at least five times above your cost-per-result goal when you use that bid strategy.
Those floors tell you what Ads Manager will accept, not what works. A $5 a day ad set optimised for purchases at a $40 CPA takes more than a week to buy one order. The real answer to “how much do Instagram ads cost” is a range, and third-party data puts it here:
| Metric | Third-party benchmark (Instagram or Meta) | Source and date |
|---|---|---|
| CPM, Instagram overall | $6 to $10 | Top Growth Marketing, Sept 2026 (https://topgrowthmarketing.com/instagram-ads-cost/) |
| CPM, Facebook (same auction) | $7.47 average | WebFX, updated May 2026 (https://www.webfx.com/blog/social-media/meta-benchmarks/) |
| CPC, traffic campaigns (Meta, all industries) | $0.77 average | WordStream, 2024 data, updated Sept 2026 (https://www.wordstream.com/blog/facebook-ads-benchmarks) |
| CPC, lead campaigns (Meta, all industries) | $1.88 average | WordStream, same report |
| Cost per lead (Meta, all industries) | $21.98 average | WordStream, same report |
| CPA, ecommerce purchases (Instagram) | $15 to $60 | Top Growth Marketing, Sept 2026 |
After the first month, your own account is the only benchmark that matters. Instagram CPM has risen by double digits year over year for six consecutive quarters, with growth slowing from 19% in Q3 2024 to 11% in Q3 2025, according to Tinuiti’s Q3 2025 benchmark report. Any benchmark you read is already a quarter old.
Instagram ads cost per day: the three DTC budget tiers
Think in daily budgets, because that is how Ads Manager spends and because the learning phase works in weeks. Meta’s guidance, cited by Jetfuel (Aug 2026), is that an ad set exits learning after roughly 50 optimisation events in seven days. If that event is a purchase at a $40 CPA, one ad set needs about $2,000 a week, or $285 a day, to learn properly. That number is why most “we tried Instagram ads for $20 a day” stories end badly: the algorithm never saw enough purchases to find a pattern.
Here is how we tier budgets for DTC brands, and what each tier can statistically prove.
| Tier | Per day | Per month | Purchases per month at a $40 CPA | What it can prove | What it cannot prove |
|---|---|---|---|---|---|
| Test | $50 to $100 | $1,500 to $3,000 | 37 to 75 | Whether one audience and one creative angle can buy a purchase near target CPA. One campaign, one or two ad sets, three to five creatives. | Which placement is cheapest, which creative wins across audiences, whether results hold when spend doubles. |
| Scale | $200 to $500 | $6,000 to $15,000 | 150 to 375 | Two to four ad sets each clear 50 purchases a week. Prospecting vs retargeting, Reels vs Feed, and a weekly CPA trend become readable. | Incrementality. You still cannot separate what Instagram caused from what it claimed. |
| Mature | $500+ | $15,000+ | 375+ | Holdout or geo tests, offers by audience, and a revenue forecast from spend. | Nothing structural. The constraint moves to creative production and landing page quality. |
The Test tier is where most brands should start and where most stay too long. Thirty-seven purchases a month tells you whether Instagram can work for you at all. It cannot tell you why one week was good and the next was bad; week-to-week CPA at this spend is noise. Pick one question, fund it, and move up only when it is answered.
Reels vs Stories vs Feed: do placements cost different amounts?
Yes. Instagram sells inventory in Feed, Stories, Reels and Explore, and the auction prices each separately. Reels has been the cheapest major placement for two years because Meta keeps expanding its supply: Reels was 26% of Instagram ad impressions in Q3 2025, up from 19% a year earlier, and Tinuiti notes that Reels “carry lower CPMs than Feed and Stories”, one reason Instagram’s overall CPM growth is slowing.
| Placement | CPM (third-party range) | CPC (third-party) | Source and date | What it is good for |
|---|---|---|---|---|
| Feed | $7.68 | $3.35 | WebFX, May 2026 (https://www.webfx.com/blog/social-media/meta-benchmarks/) | Considered purchases, carousels, static product shots with price on the image. |
| Stories | $6.25 | $1.83 | WebFX, May 2026 | Retargeting with urgency, swipe-up to a single-product landing page. |
| Reels | $4 to $8 | Not separately reported | Top Growth Marketing, Sept 2026 (https://topgrowthmarketing.com/instagram-ads-cost/); lower than Feed and Stories per Tinuiti Q3 2025 (https://tinuiti.com/research-insights/research/digital-ads-benchmark-report-q3-2025/) | Cold prospecting with UGC and founder video, where cheap reach is the goal. |
Two cautions before you move everything to Reels. First, a cheap impression is only cheap if the person who saw it buys. Reels audiences are scrolling with sound on, in an entertainment mindset, and click-through and conversion rates per impression usually run below Feed. Cheap CPM with a weak CPA is still expensive. Second, Advantage+ placements already push spend toward the cheapest inventory that produces your optimisation event. Manual placement splits earn their keep at the Scale tier, where each placement can reach 50 purchases a week. At the Test tier, leave placements automatic and spend your limited statistical power on creative.
The reliable cost difference is what happens after the click. Stories and Reels traffic is almost entirely mobile, arrives mid-scroll, and lands on a page it has never seen. If that page is your homepage or a generic collection, the cheap CPM gets spent twice: once on the impression and again on the bounce.
The Instagram ads cost calculator: budget = orders needed × target CPA
You do not need a tool for this. You need three numbers you already have.
- Target CPA. What you can afford to pay for a first order: first-order gross margin minus the profit you want to keep, or a share of 90-day customer value if you track repeat rate. At a $70 AOV and 60% gross margin, breaking even on the first order gives a $42 ceiling. Call it $40.
- Orders needed. New-customer orders Instagram must deliver this month. Say 100.
- Expected CPA, which is CPC divided by landing page conversion rate. This is where the budget moves most.
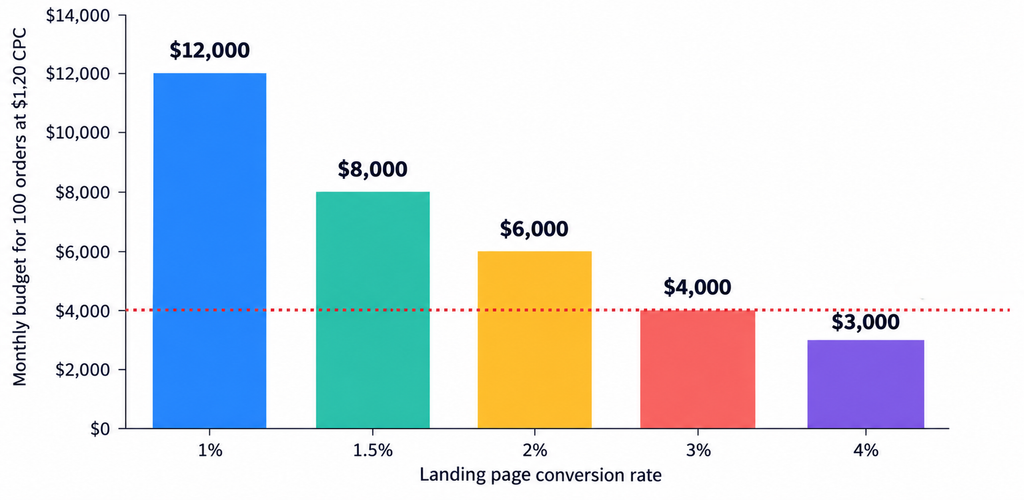
Monthly budget = orders needed × expected CPA. At a $1.20 CPC and a 3% conversion rate, expected CPA is $40 and 100 orders cost $4,000. Now change only the conversion rate.
| Landing page conversion rate | Expected CPA at $1.20 CPC | Monthly budget for 100 orders | Verdict against a $40 target CPA |
|---|---|---|---|
| 1.0% | $120 | $12,000 | Three times over target. Fix the page before buying more traffic. |
| 1.5% | $80 | $8,000 | Double the target. Still a page problem, not a bidding problem. |
| 2.0% | $60 | $6,000 | 50% over. Workable only if repeat purchase covers the gap. |
| 3.0% | $40 | $4,000 | On target. |
| 4.0% | $30 | $3,000 | Under target. Raise bids or budget; you are leaving orders on the table. |
For context on which row you are in: Shopify’s August 2026 roundup puts the global ecommerce average at 2.66% across 400+ brands (Dynamic Yield), with categories from 0.63% for luxury and jewellery to 5.7% for pet care. Those are sitewide numbers blended across warm and cold traffic. Cold Instagram traffic to a homepage usually converts well below your sitewide average. Cold Instagram traffic to a page built for that ad usually converts above it.
That is why Parah Group runs Instagram ads and landing pages for paid traffic as one program. CPC is set by an auction you do not control. Conversion rate is set by a page you do. For Binoid, a landing page program took paid social CPA down 30% in four months with no change to the media budget. For Optimize Minerals, pages built for cold paid traffic converted 40% better than the site they replaced. In the table above, a 30% CPA cut is the gap between the 2% row and the 3% row: $2,000 a month at 100 orders, $10,000 at 500.
Why mobile landing speed changes the answer
Almost every Instagram click is a mobile click, often on a cellular connection, from a person who was watching a video two seconds ago. Page speed is a budget variable.
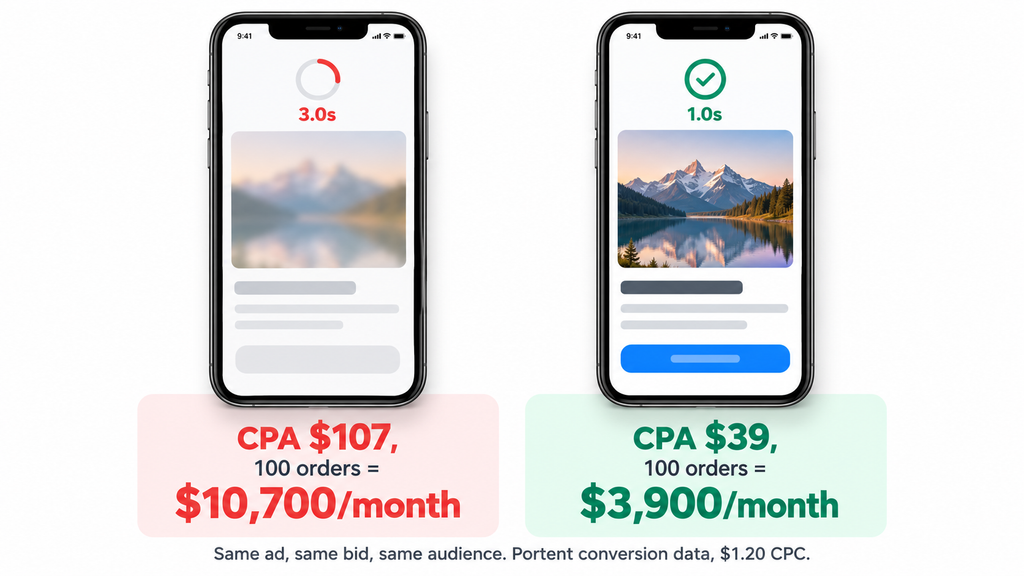
The evidence is consistent.Portent’s 2022 analysis of 5.6 million sessions found ecommerce conversion rates of 3.05% at a one-second load, 1.68% at two seconds and 1.12% at three seconds. Google’s Milliseconds Make Millions study with Deloitte (2019, 20.5 million sessions across 15 retail brands) found that a 0.1 second improvement in mobile speed lifted retail conversions by 8.4% and average order value by 9.2%.
Run those through the calculator. At a $1.20 CPC, Portent’s one-second page produces a $39 CPA and the three-second page a $107 CPA. Same ad, same audience, same bid, 2.7 times the budget for the same 100 orders. A brand that “cannot afford” Instagram at $8,000 a month can often afford it at $4,000 once the page stops wasting clicks.
Before you add a dollar to Instagram, load the destination on a real phone over a throttled connection. The usual culprits for a lost second are autoplay hero videos, uncompressed product images, tracking scripts loading before content, and app embeds that block render. On Shopify stores the fix is usually theme and app hygiene rather than a rebuild, which is why Shopify CRO sits alongside media buying in our paid programs. A dedicated landing page should load in under two seconds on mobile, and that is a launch requirement.
How to set your Instagram ads budget this month
- Write down the three inputs. Target CPA, orders needed, and your conversion rate on mobile paid traffic (GA4, segmented by source and device). Do not use your sitewide rate.
- Calculate the honest budget. Orders × (CPC ÷ conversion rate). Use $1.20 CPC as a placeholder until you have 30 days of your own data.
- Check it against the learning threshold. Monthly budget ÷ 4.3 weeks ÷ target CPA. If the answer per ad set is below 50, consolidate ad sets until each can learn.
- Name your tier and its question. Test proves one angle. Scale compares angles and placements. Mature forecasts.
- Fix the page before the bid. If expected CPA is more than 50% over target, conversion rate is the cheapest lever, and mobile speed is the first thing to check.
- Re-run the math monthly. CPM moves every quarter. Your conversion rate should move too, if someone is testing the page.
An Instagram ads agency that also builds and tests the landing pages will give you a different answer from one that only buys media, because it has two levers instead of one. That is how Parah Group’s paid social + CRO program is built: Meta, Instagram, TikTok, Snapchat and Pinterest media on one side, the pages they land on and the tests that improve them on the other, run by one team and judged on CPA and profit. We do not run Google or Bing search ads. Pricing is scoped per brand on a call.
Get a free, no-obligation audit of your ad accounts and the pages they land on. We will tell you which tier you are really in, what your budget can prove, and where the clicks are leaking. Book the audit here.
Frequently asked questions
How much do Instagram ads cost per month for a small business?
A realistic start is $1,500 to $3,000 a month, or $50 to $100 a day. Meta accepts as little as $1 a day for impression-based ad sets and $5 a day for click-based ones (Meta help center via Cropink, April 2026), but at that level a purchase-optimised ad set cannot reach the roughly 50 weekly conversions needed to exit the learning phase, so results stay erratic.
How much do Instagram ads cost per day?
Three working tiers for DTC brands: $50 to $100 a day to test one audience and angle, $200 to $500 a day to scale and compare placements, and $500 or more for mature accounts running holdout tests. At third-party CPMs of $6 to $10 (Top Growth Marketing, Sept 2026), $100 a day buys roughly 10,000 to 16,000 impressions.
Are Instagram ads more expensive than Facebook ads?
They run in the same Meta auction and CPMs are close: WebFX (May 2026) reports $7.47 for Facebook and $7.68 for Instagram Feed. Instagram CPCs run higher because click-through rates are lower on visual placements. The cost that matters is CPA, which depends on who buys after the click.
Which Instagram placement is cheapest: Reels, Stories or Feed?
Reels is usually cheapest per thousand impressions ($4 to $8, Top Growth Marketing, Sept 2026; lower than Feed and Stories per Tinuiti Q3 2025), then Stories (about $6.25) and Feed (about $7.68, WebFX, May 2026). Cheapest CPM is rarely cheapest CPA. Split placements only once each ad set can afford 50 purchases a week.
Is there an Instagram ads cost calculator?
The formula beats any tool: monthly budget = orders needed × (CPC ÷ landing page conversion rate). At a $1.20 CPC, 100 orders cost $4,000 a month at 3% conversion and $12,000 at 1%. Mobile conversion rate is the input that moves the budget most, which is why page and speed work changes the answer.
How long should I run Instagram ads before judging the cost?
At least four weeks at a budget that lets each ad set reach about 50 purchases a week, so the account exits learning and you have a month of stable data. A $20 a day test judged after ten days is noise. If four weeks at a proper budget still misses target CPA by more than 50%, fix the landing page before the bid.